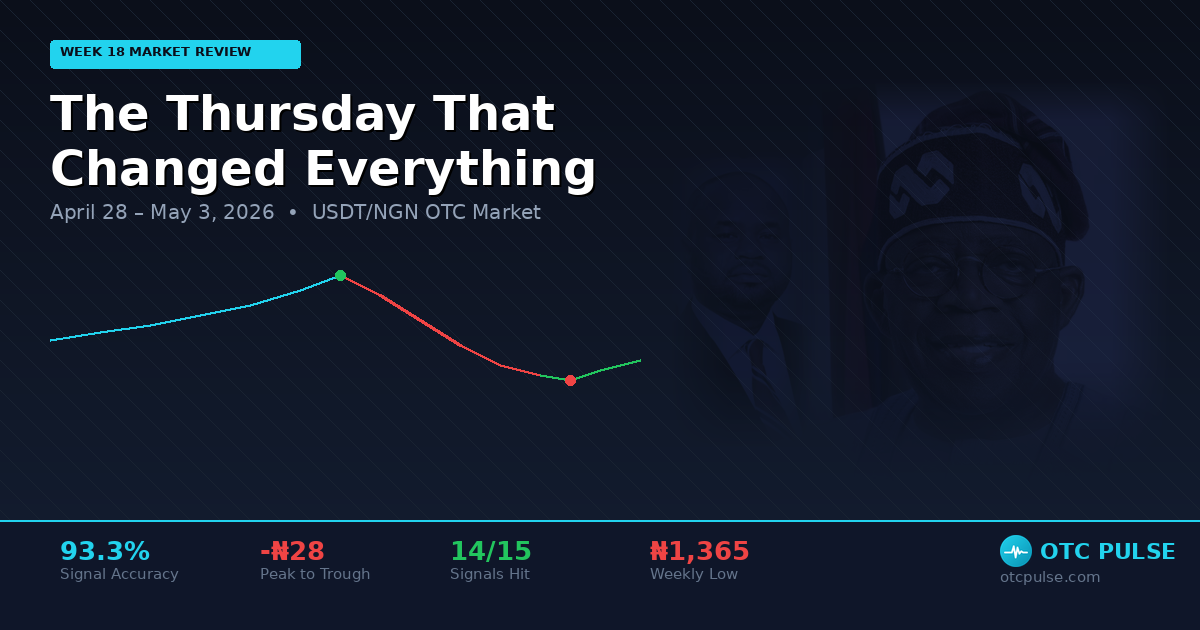
Week 18: The Thursday That Changed Everything
The week started stable above ₦1,390. Then Thursday arrived — and by Friday evening, the market had shed ₦28 in the sharpest drop since February. The signals saw it coming.
Week 18 Market Review
April 28 – May 3, 2026 • Nigerian USDT/NGN OTC Market
It was one of those weeks that separates the informed from the hopeful.
For three days, the Nigerian OTC USDT market sat comfortably above ₦1,390. Stable, predictable, almost boring. Then Thursday arrived. And by Friday evening, the market had shed ₦15 in what became the sharpest single-session drop we've tracked since late February.
But here's what makes this week worth studying: the signals saw it coming.
The Rate Journey
USDT/NGN rate movement: Week 18 (Tuesday to Saturday)
Tuesday & Wednesday: The Calm Before
The week opened quietly. USDT/NGN hovered at ₦1,387 on Tuesday morning, climbing gently to ₦1,392 by evening. On-chain activity was moderate: 150 alerts on Tuesday, 153 on Wednesday. Nothing unusual.
"7-10AM is the worst 3-hour window of the week. Wait for the afternoon."
Result: Rate drifted sideways until noon, then climbed ₦3. Textbook.
Wednesday followed the same script. The 12-3PM green window signal fired right on schedule, and the market obliged. ₦1,390 to ₦1,392.
Here's what was interesting: accumulation signals were stacking. 396 accumulation events on Wednesday alone. Wallets loading up. The question was: loading up to sell into what?
Thursday: The Break
Thursday's morning rally signal fired at 9AM: "9AM-12PM is Thursday's best window. Sell by 11AM."
That one sentence would prove to be the most valuable call of the week.
The rate touched ₦1,393 in the morning. The week's absolute peak. Then the floor dropped.
By 3PM, the rate had fallen ₦9. Our system flagged it immediately: "Below open at 3PM. History: only 5-13% chance of evening recovery." And by 6PM, the Thursday crash signal confirmed what the chain data was already screaming.
The numbers behind the scenes told the full story:
If you sold by 11AM on Thursday, you sold within ₦1 of the weekly high. If you waited until Friday, you watched another ₦8 disappear.
The historical parallel
The last time we saw a week transition from 3-day stability to a sudden Thursday break was January 16, 2025. That week, rates consolidated at ₦1,580-₦1,585 for three days before Thursday brought a ₦12 crash. The pattern is strikingly similar: accumulation masking distribution preparation, followed by a Thursday selloff as large wallets move in unison.
Friday: The Bloodbath
"Friday is a down day 54% of the time. After Thursday drops, Friday drops again 67% of the time."
Result: Rate fell another ₦5 on the day. Confirmed.
The rate opened at ₦1,383, drifted to ₦1,382 by afternoon, then the evening selling block arrived. Between 6-9PM, the rate collapsed to ₦1,378.
On-chain alerts per day. Friday was the busiest day all month
Chain activity hit a staggering 417 alerts, the single busiest day we've tracked all month. Sellers weren't just active; they were aggressive.
By 8PM, our system detected something shifting. The late recovery signal fired: "Bloodbath sellers exhausting. Watch for bounce."
The Honest Bit: What We Got Wrong
The bounce our system flagged at 8PM Friday didn't arrive Friday night. It arrived Saturday morning. The directional call was right. Selling WAS exhausting, the reversal DID form. But it took until Saturday 7AM, not Friday 11PM.
This is exactly the kind of honesty that matters. Our system identified correctly that selling pressure was exhausting, that a reversal was forming, and that the market was near a local bottom. But evening signals face a unique challenge: there simply isn't enough time between when they fire (8-9PM) and when the market responds (often the next morning).
We've since fixed this. Evening signals now carry a "PENDING" status overnight and are evaluated at midnight with results delivered at 6AM. The system isn't perfect. But it's learning.
Saturday: The Recovery
Saturday morning's dip to ₦1,365 was sharp but brief.
"Saturday morning dip. If buying, buy now."
Result: +₦7 recovery by afternoon. Week's best entry point.
Anyone who acted on that signal locked in what would become the week's best entry point. By 3PM, the rate had climbed back to ₦1,372. That's a ₦7 recovery from the morning low.
The week closed with the rate hovering around ₦1,371. Down ₦21 from Thursday's peak, but ₦6 above Friday's low.
Signal Scorecard
| Signal | Time | Prediction | Result |
|---|---|---|---|
| Tuesday Trap | Tue 7AM | Avoid 7-10AM | ✅ Flat then rose |
| Green at 3PM | Tue 3PM | Stays green 80-92% | ✅ Closed +₦5 |
| Evening Slide | Tue 6PM | Lower overnight | ✅ Wed opened -₦2 |
| Best Window | Wed 11AM | 12-3PM green | ✅ +₦2 confirmed |
| Green at 3PM | Wed 3PM | Stays green | ✅ Held ₦1,392 |
| Morning Rally | Thu 9AM | Sell by 11AM | ✅ Peak then -₦9 |
| Red at 3PM | Thu 3PM | No recovery (5-13%) | ✅ Dropped further |
| Thursday Crash | Thu 6PM | Hardest evening | ✅ To ₦1,383 |
| Down Day | Fri 6AM | Down after Thu (67%) | ✅ -₦5 on the day |
| Red at 3PM | Fri 3PM | No recovery | ✅ Fell to ₦1,378 |
| Heaviest Selling | Fri 6PM | 6-9PM worst window | ✅ Confirmed |
| Late Recovery | Fri 8PM | Sellers exhausting | ⚡ Bounce +10h late |
| Morning Dip | Sat 7AM | Buy at ₦1,365 | ✅ +₦7 by afternoon |
| Demand Window | Sat 11AM | 12-5PM climb | ✅ Rose to ₦1,372 |
| Green at 3PM | Sat 3PM | Stays green | ✅ +₦8 from open |
The Week in Numbers
What This Means for Next Week
The ₦28 swing from Thursday's high to Saturday's low isn't just a number. It's a market exhaling. Aggressive sellers moved over 1,200 distribution events in 48 hours. That kind of supply dump typically needs 2-3 days to absorb.
On Privacy: Why You'll Never See Another Trader's Wallet
Every wallet that isn't on your personal watchlist appears as an anonymized counterparty code. Something like CP-4821 or CP-7293. These are deterministic but one-way. You cannot reverse a CP code back to an address.
Your wallet, your business. The system sees patterns, not people.
OTC Pulse monitors on-chain activity to generate signals: accumulations, distributions, sell pressure, buy waves. That's how we knew Thursday's crash was coming before the rate moved. The data is real. But the identity behind it? That stays invisible.
Your own wallets? Only visible to you. Your watchlist, your labels, your trade log. All private, all encrypted behind your session. We built this system to give traders market-level intelligence without compromising individual-level privacy.
Under The Hood
Signals after 6PM now held as PENDING until midnight. Verified against actual price action and delivered at 6AM. No more grading exams mid-writing.
Supply feed and live views now display counterparty codes instead of truncated addresses. Even partial patterns can't identify traders.
New: Your Weekly Trade Report — Delivered Every Sunday
Starting this week, every trader with a linked wallet receives a professional PDF report on Telegram every Sunday morning. No action needed — it just arrives.
Numbers on a screen are easy to forget. A PDF in your hand is something you can study, share with your accountant, or reference when someone owes you money from last Tuesday.
We built this because most OTC traders have no consolidated view of their week. You remember the big trades. You forget the five small ones that ate your margin. The weekly report fixes that.
What Is Inside The Report
Every PDF includes:
- Opening and closing balance for the week (pulled directly from on-chain data)
- Daily breakdown showing how much flowed in and out each day, with transaction counts
- Counterparty summary — who you traded with most, ranked by volume
- Full trade log — every single transaction with timestamp, direction, amount, counterparty label, and estimated NGN value
- Your wallet address(es) displayed on the header so you can verify which wallet the report covers
If you have multiple personal wallets, the report merges them into one view and automatically excludes internal transfers between your own wallets. You see what matters: external trades only.
Sample Report
Here is what a typical report looks like. Scroll through it — this uses sample data with a fake name and wallet, not a real trader:
Sample report for "Adamu Kabir" — fake name, fake wallet, illustrative data only. Open full PDF
How It Helps You Avoid Losses
Most traders lose money not on one bad trade, but on a pattern of bad trades they never see. The weekly report makes those patterns visible:
- Thursday was your worst day? You traded 9K out on the same day the market crashed. The report shows it. Next week, you know to be careful on Thursdays.
- One counterparty dominates your volume? If 60% of your trades go through one person, that is concentration risk. The counterparty breakdown makes it obvious.
- Your closing balance dropped but you do not remember why? The full trade log has every transaction timestamped. Nothing hides.
This is not about judging your trades. It is about giving you visibility so you can judge them yourself.
When It Arrives
The report covers Sunday through Saturday — a full 7-day cycle with no gaps. It is delivered via Telegram as a PDF attachment. You do not need to do anything. Just have your wallet linked and the report generates automatically from your on-chain activity.
If you joined mid-week, the report notes exactly when recording started so you know the data is partial for that first week.
We Are Still Improving It
This is version one. We are actively collecting feedback from traders who received their first report this week. Some things we are considering:
- Profit and loss estimation using market rates at the time of each trade
- Week-over-week comparison so you can see trends across multiple weeks
- Custom date ranges for traders who want monthly or quarterly views
- WhatsApp delivery as an alternative to Telegram
If you have ideas for what would make this report more useful, tell us. This feature was built because traders asked for it, and it will keep improving the same way.
Tax Reports: FIRS-Ready Documentation
Nigeria's 2026 tax reform requires crypto traders to report gains through FIRS TaxPro Max. OTC Pulse now generates the documentation you need — automatically from your trade data.
The Tax Report page lets you select a tax year and instantly see your total buy and sell volume, average rates, gross profit, and estimated tax liability. The system uses FIFO (First In, First Out) matching — the standard accounting method accepted by tax authorities worldwide — to pair each sell with your earliest available purchase and calculate gain or loss per trade.
Tax Brackets (2026)
You can download the report as a PDF (hand it to FIRS or your accountant) or Excel (multi-sheet workbook with trades, summary, tax brackets, and FIFO match pairs). Both include a unique Report ID for reference.
The tax report is available now at otcpulse.com/tax. Select your year, review the preview, and download.
Every week, the system gets a little sharper. Not because the market gets easier to read (it doesn't), but because we get better at understanding where our edges are, and more honest about where they aren't.
The market doesn't care about your feelings. But the tools you use should care about your privacy, your time, and your money. In that order.
OTC Pulse: Trading Intelligence for the Nigerian USDT market.
Week 18 signal log available on the dashboard.