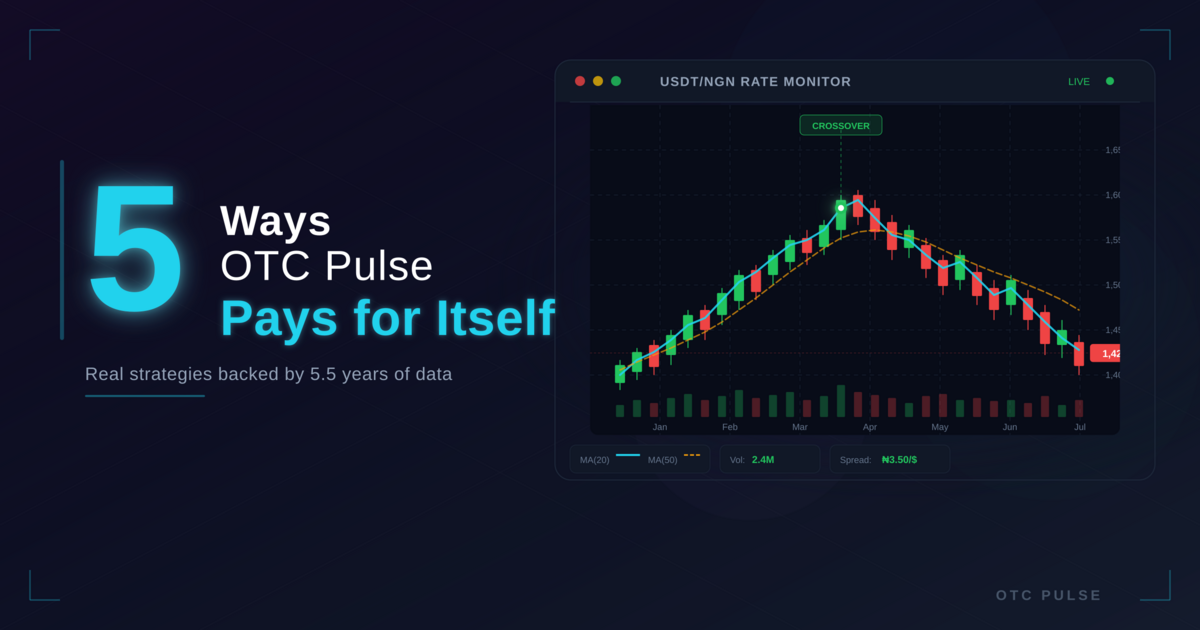
5 Ways OTC Pulse Pays for Itself — Real Strategies That Work
Real strategies. Real spread. Real talk — for Nigerian USDT/NGN traders who are tired of guessing. 5 proven ways to use OTC Pulse data to widen your spread and trade smarter.
5 Ways OTC Pulse Pays for Itself
Real strategies from real traders. Not theory, not backtests, not hypotheticals.
This post exists because of something that happened last Friday.
A trader, a real person using this dashboard, woke up early, opened Telegram, and typed /active. She looked at the buying pressure number. It said $35,000.
That is not normal. Normal USD buying pressure sits between $5M and $10M. Buying pressure measures how much USDT is flowing into tracked OTC wallets, that is, the total volume being accumulated by watched wallets. When this number is high, buyers are active and absorbing supply. When it drops, buyers have pulled back. When that number drops to $35K, roughly 100 times below normal, it means buyers have left the building. No demand. The rate is about to dump.
She did not hesitate. She sold her USDT immediately at around ₦1,376.50.
The rate dropped, exactly as the pressure number predicted. When buying pressure climbed back into the millions, she bought back in at ₦1,375. That is a ₦1.50 per dollar spread on the roundtrip. She held that position through the afternoon, watched pressure build again, and sold later at ₦1,377+, another ₦2 on the second leg.
Two trades. One morning. The only tool she used was /active.
Her entire strategy? Check who is stronger, the buyers or the sellers. If sellers are stronger and buying pressure has collapsed, she knows exactly how to position herself.
She did not have insider information. She did not use a special tool. She typed one command, read one number, and acted on what it told her. Everything below is the same idea: features you already have, used the way they were designed to be used.
That story is the entire thesis of this post. The dashboard is not complex, it is detailed. And every detail is a potential edge. Here are five ways to use it.
Strategy 1: Read the Pressure, Spot the Drop Before Everyone Else
This is the strategy from the opening story, broken down step by step.
The /active view shows you two numbers: buying pressure and selling pressure. These are not predictions. They are live aggregations of what is happening on-chain right now.
Buying pressure = USDT moving away from exchanges (withdrawals to personal wallets). This is demand: people pulling USDT off exchanges to use it OTC.
Selling pressure = USDT moving toward exchanges (deposits to exchange hot wallets). This is supply: people sending USDT to exchanges to sell it.
The /active page also shows the top buyers and top sellers ranked by volume. You can see who is accumulating and who is dumping, search through the lists, and click any wallet to see their full profile.
What to look for
The Friday play
It was a Friday. She opened /active and saw buying pressure at $35,000. Normal is $5M to $10M. That is a 99% drop. The rate was still showing ₦1,376.50, the market had not reacted yet.
She sold immediately at ₦1,376.50. The drop came fast. She bought back at ₦1,375. Profit: ₦1.50 per dollar.
She was not done. She watched buying pressure climb back. When it returned above $5M, she sold again at ₦1,377+. Second leg: another ₦2 per dollar.
Total: ₦3.50 per dollar on two roundtrips, on a Friday, using one command.
The play
- Check
/activebefore any large trade - If buying pressure is far below normal ($35K, $100K, anything under $500K), sell now
- Wait for buying pressure to return above $5M
- Buy back at the lower rate
Why this works
You are seeing the data before the market reacts. The rate does not drop the instant buyers disappear; it drops 30 minutes to 2 hours later, once sellers realize there is no demand to absorb their offers. That gap is your edge.
You do not even need to be watching
OTC Pulse has automatic pressure drop alerts built in. The system checks every 5 minutes, and if buying pressure drops to less than 20% of the 24-hour baseline (minimum $1M average), it sends you a Telegram alert immediately. There is a 6-hour cooldown so you are not bombarded, but when it fires, it means something real has changed.
When both buying and selling pressure are abnormally high at the same time, that is a different signal entirely. It means big players on both sides are active. The rate may whip in both directions within the same hour. That is the time to widen your spread, not narrow it.
The gap between when pressure drops and when the rate follows. That is your window. By the time it is being discussed in WhatsApp groups, the move has already happened.
The 3 PM Pattern
There is a specific pattern that shows up repeatedly in the data. When the market is green at 3 PM, meaning buying pressure is strong and the rate is above the day's open, it stays green through the close 80-90% of the time.
Direction at 3PM WAT tends to persist through close. Pattern strongest on Tuesday-Thursday.
The flip side is just as useful: if the rate is red at 3 PM, below the day's open, there is only a 5-13% chance of an evening recovery. That means if you are holding and it is red at 3 PM, the data says get out. Do not hope for a bounce that almost never comes.
This pattern fires consistently across different days of the week. Use it as a confirmation check alongside buying pressure. If pressure is healthy AND the rate is green at 3 PM, you can hold with confidence. If pressure is weak AND the rate is red at 3 PM, exit immediately.
Strategy 2: Supply Meter, Buy When It Is Cheap, Sell When It Is Scarce
Supply and demand is the oldest concept in trading, but most OTC traders have no way to measure it. The Supply page changes that.
A real example
A trader noticed that every Sunday evening, the supply meter showed tight conditions: most sellers had moved their USDT to exchanges during the weekend, leaving less available for OTC. He started holding his selling positions through Friday and offloading on Sunday evenings when scarcity pushed rates up by ₦1-2 per dollar. A simple pattern, visible only because the Supply page made it measurable.
The two signals
How to use it
Make the Supply page your pre-trade checklist. Before every large trade:
- Open the Supply page
- Check whether supply is tight or high relative to the past 24 hours
- If tight, you have leverage as a seller. Push for a better rate
- If high, you have leverage as a buyer. Negotiate down
This is not about timing a perfect entry. It is about not being the person who buys when supply is flooding the market, or sells when there is scarcity they could have priced into.
What the holding times tell you
The Supply Meter does not just show total USDT. It shows how many wallets are holding and how long they have been holding. That context changes everything depending on the time of day.
If a wallet has been holding for 2+ hours at 8 AM, that seller probably loaded up overnight and is waiting for the best morning rate. That is patience, not panic. Supply exists but is not hitting the market yet, which means the rate still has room to climb before they release.
If a wallet has been holding for 2+ hours at 3 PM, something is off. By 3 PM, any serious seller should have moved already. A wallet still holding at that hour means either a dump is coming or the person stepped away. Either way, if they suddenly sell, that supply spike can drop the rate fast.
Now cross-reference that with your contacts. If the wallet holding 2+ hours at 3 PM is someone you know, a big seller you have named on your watchlist, that is a very different signal than an anonymous wallet you have never seen before.
Supply alerts accuracy
When supply transitions between TIGHT and HIGH, you get an alert. The more wallets on your watchlist, the more of the market is visible to you, which means sharper signals. More wallets on your watchlist means more of the market is visible to you, which means sharper signals. We are actively working on classifying and naming every major Nigerian OTC wallet to improve this further.
Check supply before every large trade. It adds 10 seconds to your process and can save you ₦1-3 per dollar on a bad-timing trade.
Strategy 3: Supply Chain Discovery, Find the Whale Before Everyone Else
This strategy came from a real user who figured out something powerful on her own. She was not looking for a whale. She was just curious about who her regular counterparties sell to.
Here is what she did:
She opened the profiles of three of her regular contacts, OTC sellers she buys from regularly. In each profile, she scrolled down to the Counterparties section and looked at who they send USDT to. She noticed something: all three of them were sending to the same wallet.
That wallet was not on her watchlist. She did not know who it was. But the pattern was unmistakable: three independent sellers, all funneling USDT to the same buyer. That buyer was a whale.
She added the whale to her watchlist. Now she gets alerts every time that wallet accumulates. When the whale starts buying from multiple sources at once, she knows the market is about to pump, and she positions herself before it happens.
How to do this in the dashboard
When you click + Watch on a suggestion, you can name the wallet before adding it; the system pre-fills a label like "Pander buyer" based on who supplies them, but you can change it to whatever you want.
Click any contact to open their profile and you will see counterparty cards with + Add buttons for every wallet they send to or receive from:
Don't know a wallet? Look it up first
Sometimes you see an address in your counterparty cards and have no idea who it is. That is where Wallet Lookup comes in. Paste any TRON address and the system cross-references it against 2,650+ classified wallets: exchanges, known OTC desks, flagged addresses. You will know instantly if the wallet is a Binance hot wallet, a known trader, or something worth investigating further.
Trust verification, not just search
Lookup is really a trust verification tool. When someone drops a wallet in your WhatsApp group asking for a vouch, instead of relying on two people typing "Legit" (who may not be reliable themselves), paste the address into Lookup. If it shows that this wallet regularly trades with contacts you already trust, that is a chain-verified vouch. Your people already trust this wallet with their money, repeatedly. That is worth more than any group chat confirmation.
If the lookup shows zero connections to anyone you know, that does not necessarily mean they are a scammer, but it does mean you have no on-chain evidence they are trustworthy. Proceed carefully.
And if something goes wrong, if you sent funds to the wrong address or were scammed, Lookup shows where the money went. Did it move to an exchange? Which one? Did it get split across wallets? Did it end up with someone you know? Having that trail is the difference between "my money is gone" and "I know exactly where my money is."
Before you send $10K to any wallet someone dropped in a group, paste it into Lookup first. 30 seconds of checking can save you serious trouble.
Why this is so powerful
Most traders only know who they trade with directly. They have no visibility into the second layer, who their counterparties trade with. But the second layer is where the real intelligence lives.
When one contact sells to a large buyer, it could mean anything. When three of your contacts all supply the same buyer, that buyer is a whale accumulating from multiple sources. That is not a coincidence, it is a signal.
You are not just tracking wallets anymore. You are mapping the supply chain. When you see who the money flows to and set alerts on those destinations, you are front-running the market with structural intelligence, not gossip from WhatsApp groups.
The play
- Open your contacts' profiles and look at who they send to and click + Add on any wallet worth tracking
- Check the Supply Chain Suggestions section on your Contacts page
- When the system flags a wallet receiving from 2+ of your contacts, add it to your watchlist
- Set alerts on the whale buyer
- When you see the whale start accumulating, buy before the rate moves
The Charts: 6 Years of Data and How to Read Them
The rates page has data going back to September 2020. That is not exchange data or API feeds; it is actual OTC transaction data, the rates people really traded at. Six years of patterns, all searchable, all chartable.
EMA 12/50 Crossover
The chart supports EMA 12 (fast) and EMA 50 (slow) overlays. The strategy is straightforward: when EMA 12 crosses above EMA 50, momentum is shifting upward. When it crosses below, momentum is shifting down.
In practice: if EMA 12 crosses below EMA 50 at ₦1,378 and the rate drops to ₦1,374 by evening, that crossover gave you several hours of warning. If you sold at the cross and bought back at the bottom, that is a ₦4 spread on the roundtrip.
When EMA 12 (cyan) crosses below EMA 50 (gold), the rate typically follows down. Backtest: 80% accuracy at 1-3 day horizons.
RSI, calibrated for OTC
Standard crypto trading says RSI below 30 is oversold. That works on liquid exchanges. OTC is different. The USDT/NGN rate can sit at RSI 25 for days without bouncing. What we have found in the data is that the real reversal zone for OTC is at RSI 10 to 15%. That is where exhaustion actually happens. When RSI hits that range, it is a much stronger signal than a generic RSI 30 reading.
Standard RSI 30 oversold zones are too early for OTC. The real reversal happens at RSI 10-15. Backtest: 67% bounce at 5 days, 89% at 20 days.
The confirmation comes when RSI crosses back above 50% from below. That is not just a bounce; it is a momentum shift. If you entered at RSI 10-15%, the 50% crossing confirms you were right.
Strategy 4: Alerts, Get Notified Before the Market Moves
You cannot stare at the dashboard 16 hours a day. You should not have to. Alerts exist so the dashboard watches the market for you and taps you on the shoulder when something matters.
A real story: the Saturday morning alert
She was sleeping on a Saturday morning when her Telegram buzzed with an alert: one of the whale buyers she had added from Strategy 3 just received $80K worth of USDT from one of her watchlist contacts. Minutes later, a second alert came in, the same buyer, different seller, another $45K.
She did not even need to open the dashboard. Two buy alerts from the same whale back to back meant one thing: he is accumulating hard. She bought USDT immediately at the current rate and sold later when the rate climbed ₦2 higher. She made money while most traders were still asleep.
Three alert scenarios that make money
Important: buyers on your watchlist also sell. Do not assume a "buyer" label means they only buy. When you see one of your known buyers deposit USDT to Binance or another exchange, that is a sell signal, they are converting to fiat, which means they expect the rate to drop. The alert does not care about labels; it tells you what the wallet actually did.
The time advantage
The difference between getting an alert and hearing about a move in WhatsApp groups is usually 15 to 45 minutes. In OTC, that is the difference between buying at ₦1,375 and buying at ₦1,378.
Set up your watchlist. Add the wallets that move your market. Let the system watch them so you do not have to.
Alert clusters, the strongest signal
A single buy alert is information. Two buy alerts from different watchlist contacts within a short window is a pattern. Three buy alerts in quick succession is a strong confirmation signal, the market is about to pump.
The same logic works in reverse: 2-3 sell alerts clustering together (deposits to exchanges) means supply is about to flood in and the rate will drop.
Watch for these clusters. When you see 2-3 buy alerts from different watchlist wallets within a short window, the market is telling you something. The more contacts on your watchlist, the stronger this signal becomes, and that is exactly why Strategy 3 (supply chain discovery) feeds directly into this one.
The exit signal
The buy signal gets all the attention, but the exit signal is just as important. When one of your known big buyers starts depositing USDT to an exchange, they are converting to fiat. They have taken their position and are cashing out. Whatever buying pressure they were providing is about to disappear. That is your cue to sell before the rate reflects the drop.
You do not need to be the whale. You just need to see what the whale is doing and follow. When they buy from multiple sources, you buy. When they start sending to exchanges, you sell. The dashboard shows you their moves before the rate catches up.
Strategy 5: Track P&L, Know If You Are Actually Making Money
This is the strategy most traders skip, and it is the one that matters most over time.
You probably have a rough sense of whether you are profitable. "I think I made money this month." "That trade went well." "I am up overall... I think."
That is not good enough. The Trades page turns guesswork into numbers.
A real story
She logged every trade for two weeks, just 30 seconds per trade using the /trade bot command. At the end of the two weeks, she pulled up her trades page and discovered something surprising: her P&L was positive overall, but one of her five regular counterparties was actually costing her money on average. She had been giving him a slightly better rate "because they were friends", and it added up to a ₦15,000 loss over two weeks. She adjusted her rates with that counterparty and turned a losing relationship into a break-even one.
She would never have known without the numbers.
What you get
The Trades page now includes a My Trading summary at the top: your Buy Volume, Sell Volume, total Trades, and estimated Spread at a glance. Toggle between today, 7 days, and 30 days.
Every trade recorded. Log manually via /trade in the Telegram bot or through the dashboard. Amount, rate, counterparty, timestamp. No gaps.
See your actual buy-sell spread per trade and per counterparty. Know exactly how much margin you are capturing.
Spread per counterparty. Which relationships make you money? Which ones cost you? Open any contact on the Contacts page to see their scorecard.
Every Sunday at 6:30 AM, the bot sends you a PDF summary of your week: trades, volumes, P&L, and performance metrics. Your week reviewed before you even wake up.
The counterparty scorecard is where the money is
Most traders have 3-5 regular counterparties. You probably assume they are all roughly equal. They are not.
When you look at the scorecard, you will likely discover:
- One counterparty consistently gives you better rates (they need liquidity more than you do)
- One counterparty is actually costing you money on average (you trade with them out of habit, not profit)
- Your most profitable relationship is not the one with the highest volume, it is the one with the best spread
A trader who tracks spread makes better decisions than one who trades on feel. Not because the data is magic, because it kills the comfortable lies you tell yourself about which trades are working.
Why logging matters more than you think
How do you know the rate you gave that buyer was actually good? Without a log, you are guessing. With a log, you know exactly what rate you traded at, what the market rate was at that moment, and what your actual spread was.
At the end of the month, when you check your bank statement, every credit and debit should match a trade in your log. If there is a transaction you cannot account for, you have a problem. The trades page makes reconciliation straightforward.
Not every trade happens on-chain either. Some are bank-to-bank, some involve exchange deposits. Log those too. And name your counterparties. When your trades page shows "Bought $5K from Bukis at ₦1,375" instead of "Bought $5K from CP-4821 at ₦1,375," that is a business record you can actually use.
Bonus: The Rate Feed, Let the Bot Post for You
Consider the trader who posts his rate in 15 WhatsApp groups every morning. By the time he reaches group 12, the rate has already moved. A customer from group 3 calls with the old rate, and now there is an argument because the rate moved ₦2 since he posted. Or the one who forgets to update for 3 hours. Someone sees the stale rate, sends money, and now there is a dispute.
The /rate command fixes this entirely. Type /rate in the Telegram bot, set your buy rate and sell rate, and every connected channel updates simultaneously. You buy at ₦1,375, you want to sell at ₦1,377. That is ₦2 spread. Set it once, and your WhatsApp channel, your Telegram group, all of them show the same number within seconds.
Rate moves? Type /rate again. Three seconds. Every channel updates. No more copying and pasting across groups. No more stale rate disputes. No more lost spread because you forgot to update.
If you can type /rate in Telegram, you can set up your feed. No coding, no API keys, nothing complicated. Combined with Strategy 1 (pressure reading), you can adjust your rates based on what the data tells you. If buying pressure drops, lower your sell rate before the market catches up. If pressure is building, raise your buy rate to fill orders before the spike hits.
The Compound Effect
None of these strategies require genius. They require a screen, 30 seconds of checking, and the discipline to act on what the data says instead of what the WhatsApp group chat says.
Each strategy is a small edge. But small edges compound. A trader who checks pressure before selling, verifies supply before buying, maps the supply chain to find whales, gets alerts instead of gossip, and tracks actual P&L, that trader does not just make better individual trades. They build a system that gets more profitable every week.
Start Now
You do not need to use all five strategies at once. Start with one.
If it is below $500K and you are holding USDT, you now know what that means. If it is above $5M, the market has demand. Act accordingly.
The dashboard is not complex. It is your unfair advantage. Use it.